
The linear topology is the most commonly used in CAN bus routing specifications. However, when a "T" branch connection is used in this configuration, the branch length must not exceed 0.3 meters according to the standards. But what should you do if a longer branch is required?
First, understanding CAN topology types
CAN (Controller Area Network) is a widely used fieldbus protocol in industrial automation and vehicle networks. It is a multi-master, asynchronous serial communication system that supports distributed and real-time control. The main topologies for CAN networks include linear, star, tree, and ring structures. Each has its own advantages and limitations, as illustrated in Figure 1.

Figure 1: CAN Topology Features
Second, wiring in a linear topology
According to ISO 11898-2, the high-speed CAN physical layer recommends using a linear bus topology. In this configuration, all nodes are connected via a single common bus. This topology is simple to implement, as it only requires proper termination resistors at both ends of the bus—typically 120Ω for a 2 km network. As shown in Figure 2, the linear layout ensures stable signal transmission with minimal interference.
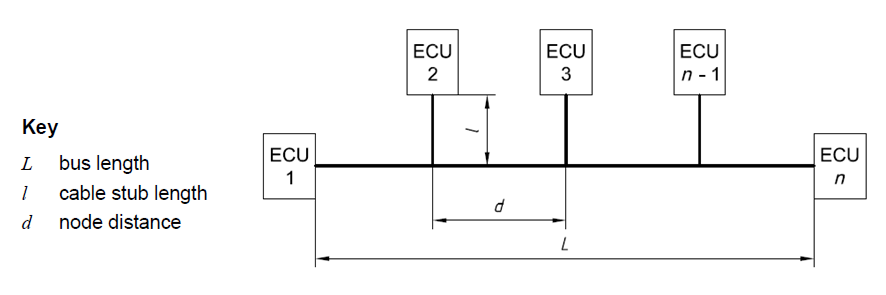
Figure 2: Linear Topology Layout
A common implementation of the linear topology is the "hand-in-hand" configuration, where nodes are connected sequentially along the bus, as seen in Figure 3.
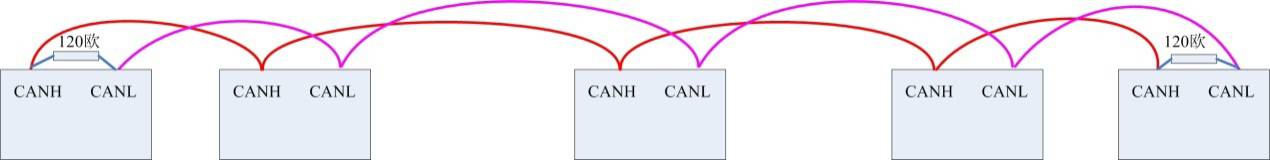
Figure 3: "Hand-in-Hand" Connection
In industrial settings, however, long cable runs often require terminal blocks for easier maintenance. This leads to the use of "T" type branches, as shown in Figure 4.
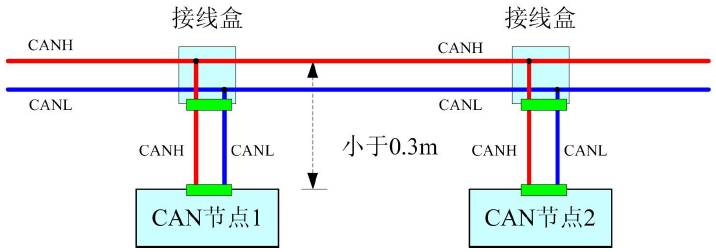
Figure 4: "T" Type Branch Connection
Third, constraints on "T" type branch length
When using a "T" type connection, the impedance mismatch caused by the branch can lead to signal reflections. These reflections can cause signal distortion, such as undershoots, which may fall below the noise margin and result in communication errors. To minimize this, the branch length should be kept as short as possible.
As shown in Figure 5, ISO 11898-2 specifies that the maximum branch length at 1 Mbit/s is 0.3 meters. Since 1 Mbit/s is the highest data rate supported by CAN, this limit applies to lower baud rates as well to ensure stable operation.

Figure 5: "T" Type Network Parameters
Fourth, how to determine acceptable branch length
While ISO 11898-2 sets the 0.3-meter limit at 1 Mbit/s, there may be situations where a longer branch is necessary. In such cases, the branch length can be adjusted based on the specific baud rate. However, the signal quality must still meet the requirements outlined in the standard.
To evaluate signal quality, key parameters such as minimum and maximum voltage levels, signal amplitude, rise and fall times, and signal integrity need to be measured. These metrics are defined in ISO 11898-2, as shown in Figure 6.

Figure 6: Signal Quality Parameters
Without specialized tools, assessing signal quality manually is time-consuming. A practical solution is to use a tool like CANScope, which offers a signal quality analysis plug-in. This tool automatically evaluates waveforms from each node and provides a visual histogram (as shown in Figure 7), allowing for quick and accurate assessment of signal integrity and physical layer performance.
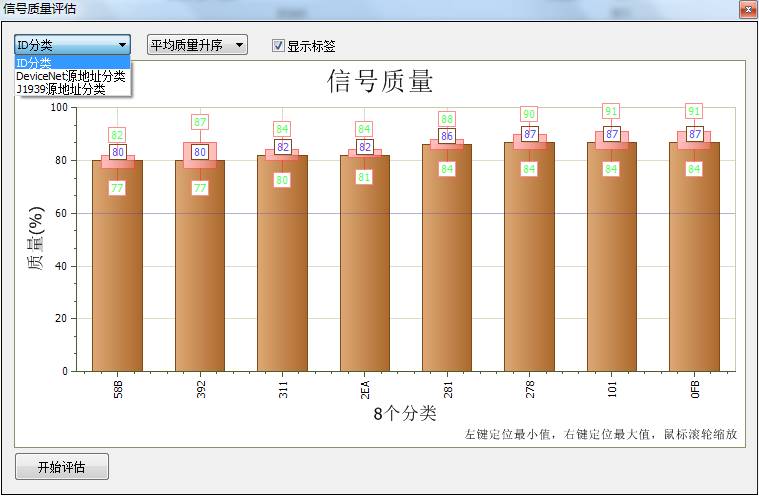
Figure 7: Signal Quality Histogram
Power Meter is a monitoring and testing instrument which determines the power consumption of a connected appliance and the cost of the electricity consumed.
Installing the batteries
Install 3.6V rechargeable Battcrics(NI-MH) . The purpose of the batteries is to store the total electricity and mcinory setting.
Resetting
If an abnormal display appears or the buttons produce no response, the instrument must be reset. To do this,press the RESET button.
Display Mode
Entire LCD can be displayed for about 1 minute and then it automatically gets into Model. To transfer from one mode to the other, press the FUNCTION button.
Mode 1: Time/Watt/Cost Display Display duration(how long) this device connect to power source.LCD on first line shows 0:00 with first two figures mean minutcs (2 figures will occur while occur at 10 min) and the rest shows seconds. After 60mins, it displays 0:00 again with first two numbers meas hour(2 figures will occur at 10hours) and the rest shows minutes. The rest can be done in the same manner which means after 24 hours, it will rc-caculatc. LCD on second line displays current power which ranges in 0.0W~9999W. LCD on third line displays the current electricity costs which ranges in 0.0cost~9999cost. It will keep on O.OOcost before setting rate without other figures.
Mode 2: l ime/Cumulative electrical quantity Display Display duration(how long) this device connect to power source.
LCD on first line shows 0:00 with first two figures mean minutes(2 figures will occur while occur at 10 min) and the rest shows seconds. After 60mins, it displays 0:0() again with first two numbers meas hour(2 figures will occur at 10hours)and the rest shows minutes. The rest can be done in the same manner which means after 24 hours, it will re-caculate. LCD on second line displays current cumulative electrical quantity which ranges in 0.000K WH 〜 9999KWII without other figures. LCD on third line displays''DAY''- "1 "will be showed on numerical part(thc other three figures will be showed at carry) which means it has cumulated electrical quantity for 24hours(one day). The rest can be done in the same manner untial the maximal cumulative time of 9999 days.
Mode 3: Time/Voltage/Frequency Display LCD on first line displays the same as Mode 1 dones. LCD on second line displays current voltage supply (v) which ranges in 0.0V~9999V .LCD on third line displays current frequency (HZ) which ranges in 0.0HZ~9999HZ without other figures.
Mode 4: Time/Current/Power Factor Display LCD on first line displays the same as Mode 1 dones.
LCD on second line displays load current which ranges in 0.0000A~9999A. LCD on third line displays current power factor which ranges in 0.00PF 〜 1 .OOPF without other figures.
Mode 5:Time/Minimum Power Display LCD on first line displays the same as Mode 1 clones. LCD on second line displays the miniinum power which ranges in 0.0W~9999W. LCD on third line displays character of "Lo" without other figures.
Mode 6: I,ime/Maximal Power Display LCD on first line displays the same as Mode 1 dones. LCD on second line displays the maximal power which ranges in 0.0W~9999W. LCD on third line displays character of "Hi" without other figures.
Mode 7: Time/Price Display LCD on first line displays the same as Mode 1 dones. LCD on third line
displays the cost which ranges in O.OOCOST/KWH 〜 99.99COST/KWH without
other figures.
Overload Display: When the power socket connects the load over 3680W, LCD on second line
displays the"O VER LOAD" with booming noise to warn the users,( 60470643,
60469303,selectable choice)
Supplemental informations:
1: Except tt OVERLOAD , ' interface, LCD on first line display time in repitition within 24hours.
2: LCD on first line, second line or third
line described in this intruction take section according to two black
lines on LCD screen. Here it added fbr clarified purpose.
3. Mode 7 will directly occur while press down button "cost".
4. [UP"&''Down" are in no function under un-setting mode.
Backlight Mode:
Connect to AC power,backlight im mediately light,if not press any button,backlight will went off in 15 seconds.
When press any of the buttonsbacklight
start light again. (Backlight only light when it connect to AC
power,backlight cannot light if use battery)
Setting Mode
1. Electricity price setting
After keeping COST button pressed lasting
more than 3 seconds(LCD on third line display system defaults price, eg
O.OOCOST/KWH ),the rendered content begins moving up and down which
means that the device has entered the setting mode. Then press FUNCTION
button to change selection and press UP/DOWN to set what you want. (On
pressing once, the figure after domical point will increase or decrease
accordingly. On pressing and hold-on, figures after demical point will
increase or decrease slowly in 2 seconds while figures change quickly
when hold-on time exceeds 2 seconds. When hold-on time reaches 10
seconds or more, the figures after demical point will stop while the
figures before demical point begin to increasing or decreasing.) After
that, press FUNCTION fbr swithing, then press [UP'nd "DOWN" button again
to set value which ranges in OO.OOCOST/KWH 〜 99.99COST/KWH. After
setting all above, press COST to return to Mode7 or it will
automatically return to Mode7 without any pressing after setting with data storage.
Power meter double rates, power meter two rates, cost rate socket, power meter cost rate, energy meter cost rate, cost socket, cost plug
NINGBO COWELL ELECTRONICS & TECHNOLOGY CO., LTD , https://www.cowellsocket.com