
O Introduction
In recent years, the incidence of heart disease has been increasing, and portable mobile ECG monitoring equipment has become an urgent need for people with poor heart conditions. It is necessary to consider the equipment to be convenient to carry and use, and to ensure that the ECG signal is analyzed and processed with high quality, which requires the use of hardware and software resources that are optimized as possible to achieve the corresponding functions. The hardware selects AT91SAM9261S chip, and adds peripheral components such as LCD screen and SD card to form the hardware test platform required for design. Accordingly, the software development environment is selected as IAR Embedded Workbench IDE 5.4.
1 How the system works The test platform is based on the AT91SAM9261s. The ARM9 chip operates at 210 MIPS at 190 MHz, with 16 KB data cache and 16 KB instruction cache, 32 KB on-chip ROM and 16 KB on-chip SRAM. These features ensure the reliability and real-time performance of the entire ECG system.
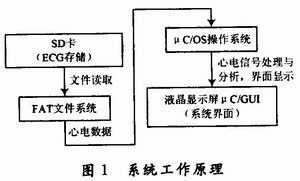
The overall planning and design of the system is shown in Figure 1. The ECG signal is read from the SD card, pre-processing and feature analysis are performed, and the diagnosis of ECG is performed by the RR interval and the width of the QRS wave. Provide feedback, if there is some kind of ECG disease, give feedback information, and the guardian can give corresponding treatment according to the situation of ECG.
This article refers to the address: http://
2 system software design
2.1 The establishment of the software test environment The specific tasks that need to be completed include the underlying driver development, the transplantation of the μC/GUI and the FAT file system.
In the IAR Embedded Workhench IDE 5.4 development environment, build the project, transplant the μC/OS operating system and μC/GUI, debug through Jlink, ensure the normal operation of the hardware, in order to smoothly read the ECG stored in the SD card. Signal (dat format), you also need to port the FAT file system to the project. During the migration process, refer to the AT91SAM9261S data sheet for parameter configuration. The first is the system CPU frequency configuration and the hardware interface configuration related to the LCD screen (including the data transmission port and SPI port configuration, etc.), and the highest operating frequency of the LCD screen. Correspondingly, the system operating frequency is 174 MHz, and there are other register settings. The porting of μC/GUI and FAT file system only needs to modify related parameters, such as various parameters of the LCD screen, and registers for reading data. Address, etc. This allows you to write the interface required by the system to facilitate the display of various waveforms and results of the ECG signal.
2.2 ECG signal processing and analysis Here, the ECG signal of the MIT-BIH ECG database is used. After reading the dat file, the original ECG signal can be obtained by parsing and downsampling according to its storage format. It is processed and analyzed.
2.2.1 The frequency of pre-processing ECG signals is at O. Between 05 and 100 Hz, the common noises include: 60 Hz power frequency interference and its harmonics, and the frequency generated by respiratory motion and electrode movement is less than 5 Hz interference and muscle contraction. noise. In order to obtain a normal ECG waveform, these interferences must be filtered out. Considering that the center frequency of the QRS complex is around 17 Hz and the bandwidth is about 10 Hz, low-pass filtering, high-pass filtering, and comb filters are used here.
Considering the digital computing capability of AT91SAM9261S and the real-time requirements of the system, low-pass filtering and high-pass filtering use simplified FIR filtering. The filter coefficients are obtained by the firl function in Matlab environment, and a linear phase high-pass filter of 0.05 Hz is realized. And a linear phase low pass filter of 100 Hz. Here the coefficient of the high pass filter is: b = [O. 000 0, O. 000 2, O. 999 2,-O. 000 2, O. 000 O]; a = [1.000], the coefficient of the low pass filter is: b = [O. 011 1,0.488 9,O. 488 9,0.011 1]; a=[1.000]. The notch designed here uses a subtraction technique that uses an all-pass network minus the output of a narrowband bandpass filter with the same propagation delay and gain to obtain a notch (NOTCH) with sharp notch characteristics. The principle is shown in Figure 2.
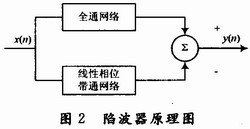
The notch filter is actually a comb filter whose transfer function is: 
Where: Q = R / P.
In practical application, the sampling rate Fs is 360 Hz, the power frequency interference Fc is 60 Hz, then P=Fs/Fc=6, n and R determine the stopband bandwidth of the filter. By parameter adjustment, the system selects n=2. , R = 162, then there is Q = 27. The above filter has a good filtering effect on the 60 Hz power frequency and its harmonics and fundamental frequency interference.
2.2.2 Waveform Detection and Analysis Waveform analysis includes QRS complexes and P and T-wave detection markers. Regarding the QRS complex detection portion, the differential signal y(n+1)-y(n-1) is calculated, and the presence of the R wave is detected by combining the threshold setting of the original ECG signal and the differential signal and the change of the differential signal symbol, and The RR interval is simultaneously calculated by the RR interval, and then the position of the QRS complex is determined before and after the R wave according to the characteristics of the Q and S waves. The P and T waves are also detected by referring to the position of the QRS complex in combination with the change in the differential value.
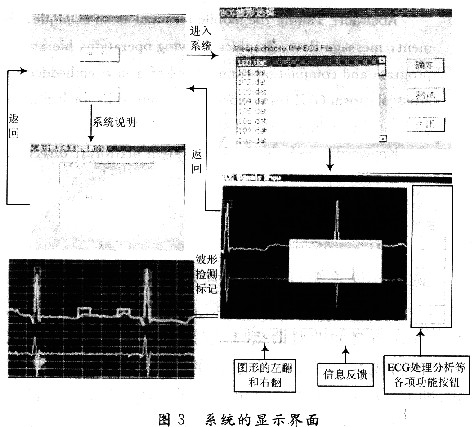
3 System results display and analysis The design can realize the automatic diagnosis of ECG signals, make judgments and feedbacks on ECG conditions, and give visual display and marking of various waveforms and eigenvalues. Write the interface you need under μC/GUI to display the results of various detection and analysis of ECG signals. As shown in Figure 3, you can draw ECG waveforms and differential signals and perform R-wave labeling.
Here, the system has been strictly tested. When the ECG data width is 3 min, that is, the number of data points is 64 800 (ie 360×180), the whole processing analysis takes less than 2 s. The whole processing analysis algorithm is very good. Real-time requirements have been met. The R wave detection results of the ECG signal (take the first 12 000 points) in the MIT-BIH standard ECG database are given below. As shown in Table 1, the total R wave detection accuracy is 96.93. %, accurate R wave detection provides a strong guarantee for subsequent further testing and diagnosis.
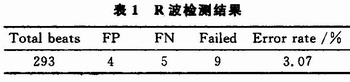
Description: The test files are 100, 101, 102, 103, 105, 106, 107, 111, 112, 113, 114, 115, 116, 117 and 118.
4 Conclusion This paper describes the design of the automatic diagnosis system for ECG diseases, completes the hardware-side driver and software-side signal processing and analysis display. The algorithm used is simple and effective, and meets the real-time requirements of small disease diagnosis systems. At the same time, there are still many deficiencies in the system, such as the expansion of the hardware platform and the improvement of the ECG algorithm, which requires further improvement.
Medical Power Adapter,Power Adapter For Medical,Medical Ac Adapter,Medical Usb Power Adapter
Ninghai Yingjiao Electrical Co., Ltd. , http://www.yingjiaoadapter.com